

Salix Agents

Monitor Windows, Linux and macOS servers from the inside

Salix Agents add host-level server monitoring to the same workspace as your external checks. Install a lightweight agent on Windows, Linux or macOS to report practical health signals over outbound HTTPS, helping you see CPU, memory, disks, services, processes, logs and OS-specific evidence without opening inbound monitoring ports.

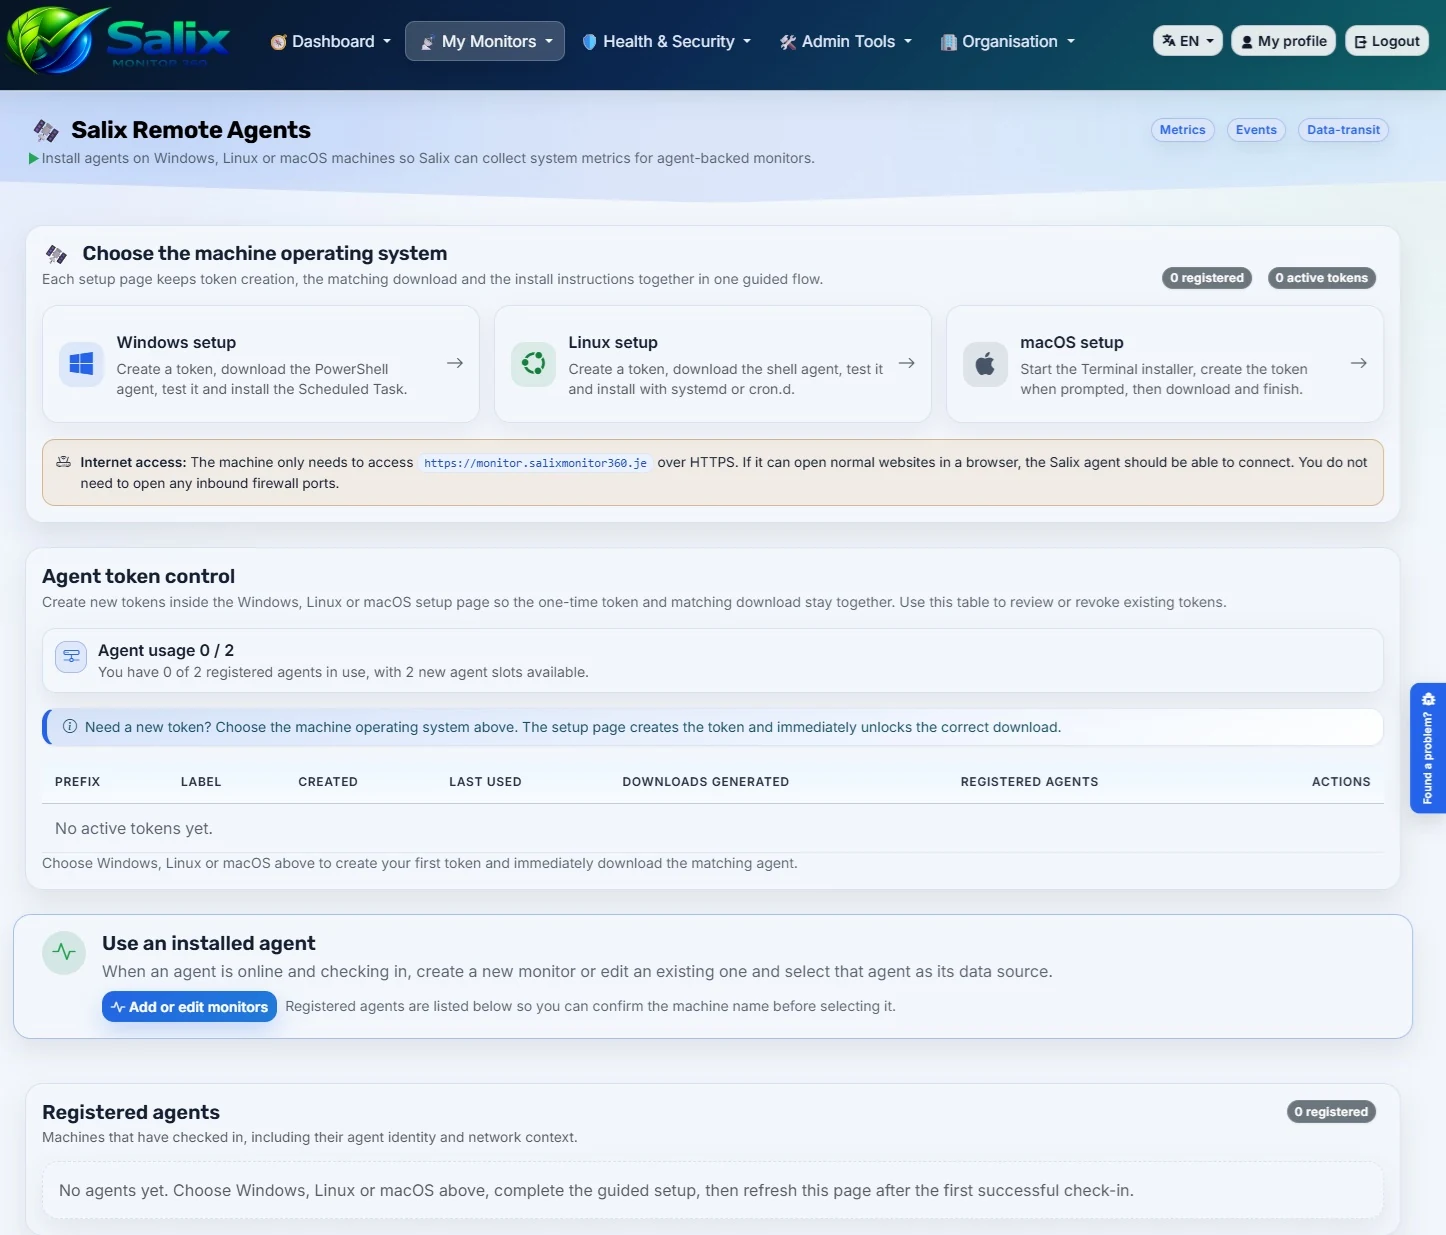
Current app view

Agent setup, tokens and check-ins in one place

The agents page now shows setup guidance, token creation, downloads, install commands and registered machine check-ins together, so rollout stays understandable.

Agents page in Salix Monitor 360
Salix Agents pageTokens, downloads and check-ins

What agents do

Most monitoring checks a service from the outside. That’s useful - but it doesn’t always explain why something is slow, failing, or unstable. Agents add an “inside view”: they live on the machine and report the kind of signals you’d normally check when troubleshooting.

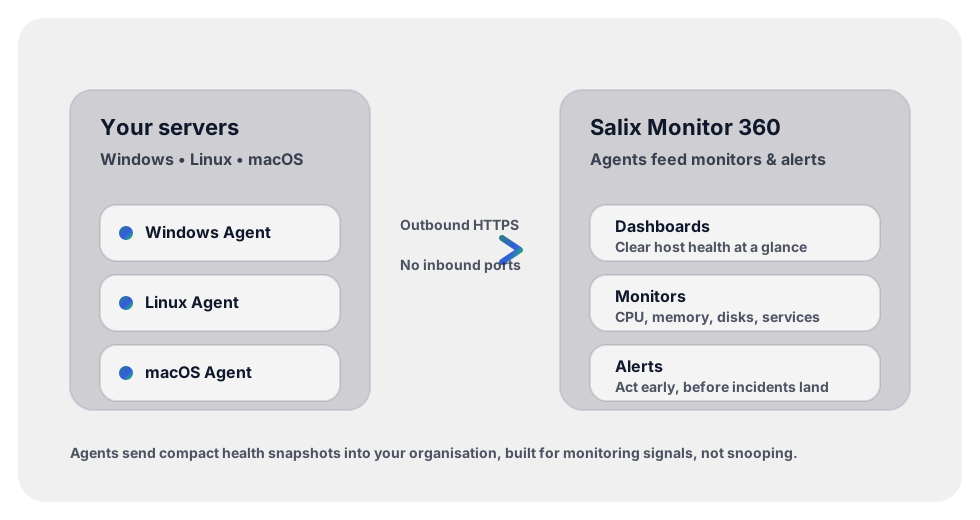
Diagram: agents on servers send health snapshots into Salix Monitor 360

Three agents, with OS-specific monitor types

Salix Monitor 360 provides three agents: one for Windows, one for Linux, and one for macOS. They share the same simple install-and-report idea, but their active monitor types are deliberately kept separate by operating system.

  • Windows Agent - Windows host health, logical disk checks, Windows services, process signals and Windows Event Log sources.
  • Linux Agent - Linux host health, disk mount checks, services/daemons, process signals and Linux log sources.
  • macOS Agent - macOS host health, disk mount checks, services/daemons, process signals and macOS log sources.

In the monitor form, a Windows monitor type requires a Windows agent, a Linux monitor type requires a Linux agent, and a macOS monitor type requires a macOS agent. That keeps the setup honest and stops a monitor being attached to the wrong kind of machine.

Easy to set up. Easy to trust.

Agents are built for “no drama” rollout: you generate an agent token in the app, install the agent on the machine, and it starts reporting.

  • No inbound firewall changes - agents connect out over HTTPS on TCP port 443.
  • One agent per host - clean, predictable, and easy to manage.
  • Revoke anytime - if you rotate access, you can disable a token instantly.

The goal is simple: quick setup, reliable signals, and a clear view of server health without turning your monitoring into a project.

Straightforward deployment

What an agent needs to work

A Salix Agent does not need an inbound internet route or a complicated network redesign. Give it a supported host, an organisation-scoped token and a normal outbound web connection.

The practical requirements

  • A Windows, Linux or macOS host that matches the agent you install.
  • Outbound HTTPS on TCP port 443 to your Salix Monitor 360 service.
  • DNS resolution so the host can reach the service by name.
  • An agent token generated inside the correct organisation.
  • Permission to install and run the agent on the machine.

You do not need to open an inbound port, expose the host with a public IP address, or allow Salix to initiate connections into your network.

Why use Salix Agents?

  • Faster diagnosis - pair an external failure with CPU, memory, disk, service or process clues from the host.
  • Coverage for private systems - include internal servers and devices that are not publicly reachable.
  • One operational picture - bring host health into the same dashboards, incidents, alerts and reports as service monitoring.
  • Start small - prove the value on one important machine, then expand at your own pace.

The result is a shorter path from “something is wrong” to a useful explanation of what the machine is doing.

What do agents actually report?

Agents send compact metric snapshots for useful monitors and alerts. They are designed for operational health rather than collecting user content.

Host health signals

  • CPU - usage and pressure signals for the host.
  • Memory - memory pressure and swap-style warning signs where the agent reports them.
  • Disk usage - Linux/macOS mounts and Windows logical drives, with picker support when the agent has reported inventory.
  • Uptime - unexpected restarts and stability clues.
  • Network interfaces - interface names and counters where they are present in the agent payload.

These are the practical host signals most teams need when they want servers to stay boring in the best possible way.

Active monitor types are matched to the agent OS

  • Windows checks - use Windows agents for Windows host metrics, services, processes, logical disks and Event Log sources.
  • Linux checks - use Linux agents for Linux host metrics, disk mounts, services/daemons, processes and Linux log sources.
  • macOS checks - use macOS agents for macOS host metrics, disk mounts, services/daemons, processes and macOS log sources.
  • Wrong-OS pairing is avoided - the app shows matching agents for the selected OS-specific monitor type.

The app only offers agents that match the selected OS-specific monitor type, keeping setup clear and accurate.

Service, process, disk and log inventory

  • Services/daemons - pick from services the selected agent has reported.
  • Processes - use reported top-process data to help choose meaningful process checks.
  • Mounts and drives - select Linux/macOS mounts or Windows drive/volume labels where available.
  • Logs and Event Logs - Linux/macOS log sources and Windows Event Log sources are treated separately.

Inventory-backed dropdowns depend on what the agent has actually checked in with, so setup stays grounded in the real machine rather than guesswork.

Visible on dashboards and TV mode

  • Agent freshness - see when a host last checked in.
  • Host status - bring CPU, memory, disk and service signals into clear views.
  • Shared visibility - show important host health in the normal administration dashboard when it is opened in TV mode.

This helps teams spot stale agents and unhealthy hosts before a small server problem becomes the day’s surprise parcel.

Agent security & privacy

Agents communicate over HTTPS and use a token created in your Salix Monitor 360 account. If you revoke the token, the agent can’t report any more. That’s the control lever.

  • Purpose-built: data is scoped for monitoring signals you configure.
  • No inbound exposure: agents connect out; you don’t open ports to the internet.
  • Role controlled: who can see agent results follows your organisation’s permissions inside the app.

Where do agents fit best?

Agents are brilliant for internal endpoints - the machines that are critical but not necessarily public: domain controllers, file servers, internal APIs, database servers, build agents, and “that one box nobody wants to touch”.

Use agents alongside your normal monitors. External checks tell you what users see; agent-backed OS checks help explain what the Windows, Linux or macOS machine is doing. Together, they give you faster answers and fewer guesswork incidents.